A/B Test Analysis: Balancing Conversion and Revenue in Offer Optimization for a Mobile Game
In this case study, I analyzed an A/B test comparing two offer versions to evaluate their impact on conversion rate and average revenue per user (ARPU).
While the test group showed a statistically significant decrease in conversion rate (Z = 2.108, p = 0.035), it also delivered a 5.3% increase in ARPU. Through detailed statistical testing and visual analysis, I found that the test group generated more revenue per 1,000 users, despite lower conversions — presenting a classic trade-off between quantity and quality of users.
This case highlights the importance of analyzing multiple metrics (conversion, ARPU, revenue per user) before making business decisions and demonstrates how data-driven insights can challenge initial assumptions.
This case study was done using Google Colaboratory. 👉 Link to see the work 👈
Summary
The test group leads to significantly fewer conversions, but also produces slightly higher revenue per user. While the ARPU increase isn’t statistically significant, it results in more revenue per 1,000 users overall. The decision to roll out the test version depends on business strategy — prioritizing reach and conversions, or maximizing revenue per user.
Recommendation
Even though the test offer converted fewer users, it showed a 5% revenue increase per user. Since that difference wasn’t statistically significant, I don’t recommend rolling it out based on this test alone — but I recommend retesting. If that uplift holds, it could justify the trade-off.
Context
The test group has a 5% higher ARPU than the control group. In the control group, 1928 users out of 202,103 are paying customers. In the test group, 1805 users out of 202,667 are paying customers.
📊 Data Sources:
ab_test.csv: Includes user_id, revenue, and testgroup columns.
💡 Challenge:
Decide which offer set performs best, and determine the appropriate metrics for a robust evaluation.
What the data tells us:
•   The test group converts fewer users, and the difference is statistically significant.

•   But the test group earns more revenue per user — although this increase is not statistically significant.

•   Still, the absolute revenue per 1,000 users is €1,337 higher in the test group, which may justify the trade-off dep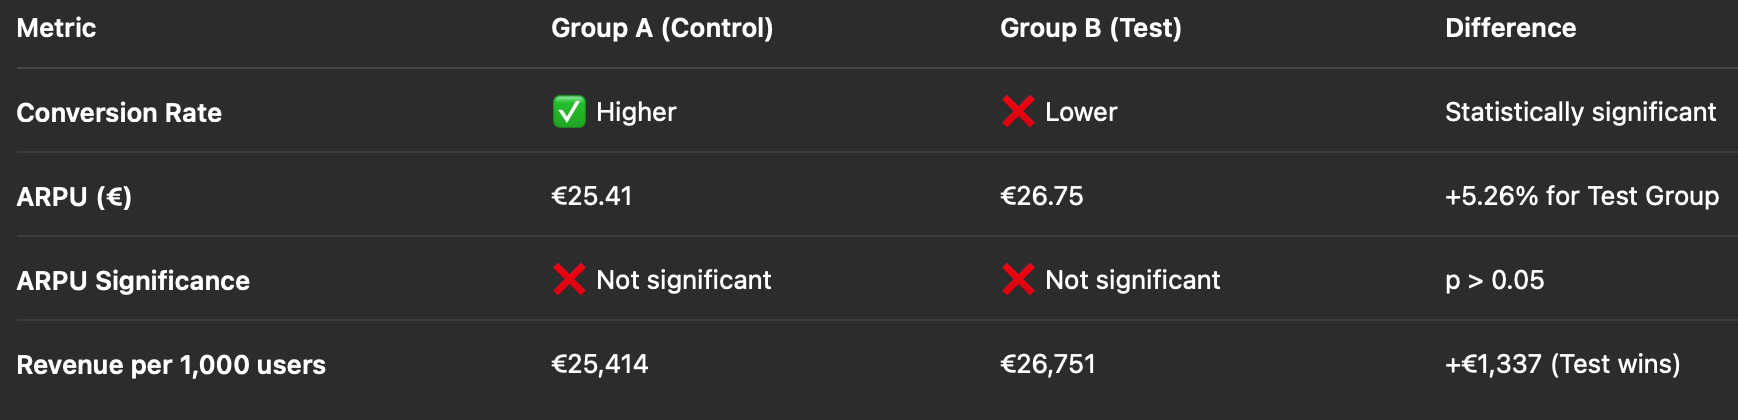
For detailed steps and code please check the Colaboratory link above. I will summarize the key points here.
First step was loading the data.
Then I viewed the data and noticed it needs couple steps of cleaning before I can use it for testing.
Once cleaned, I tested the data now works (below values were received) and we can proceed to the actual test.

Conversion Rate Comparison (Z-test)
For the code itself please see the Colaboratory file. Data shows conversion Rate Z-test: Z-score = 2.1080 p-value = 0.0350
📊 Statistically significant difference in conversion rates (p < 0.05). ⚠️ Test group (B) performs worse in conversion rate.

The test group had a statistically significant decrease in conversion rate compared to the control group (p = 0.035). While fewer users converted, further analysis is needed to understand whether the revenue per user justifies the trade-off.
Testing ARPU
Because the test group reportedly has 5% higher ARPU, it may still win overall — even with lower conversion.
I used Welch's t-test
Now you might be asking why Welch’s t-test? (Not the standard Student’s t-test): Because
👉 I’m are comparing means between two independent groups (a and b) — and the variance and sample sizes are NOT guaranteed to be equal.
Chat GPT’s clarifying answer:

Result: No statistically significant difference in ARPU.
I thought to still compare the revenue itself to see what is the difference. Then the results showed:
ARPU (A): €25.4137
ARPU (B): €26.7513
ARPU Lift: 5.26%
Revenue per 1,000 users:
A: €25413.72
B: €26751.29
Difference in ARPU is not statistically significant, BUT comparing revenue per 1000 users shows that there is a difference of 1337€. Therefore I recommend weighing this trade-off before making final strategy decisions.
Based on the image below, we have some high-paying users in group b only. This gives another points to consider before making final strategy choice.
