Restaurant Food Waste Reduction Data Model (Multilocation restaurant chain)
Summary
This is a portfolio model built to demonstrate how I approach multi-entity schema design for operational analytics problems. Designed an integrated data model combining orders, inventory, deliveries, and campaigns to support food waste reduction analysis across a multi-location restaurant chain, enabling operational reporting, FIFO compliance tracking, and root-cause analysis.
🔹 Key Design Choices
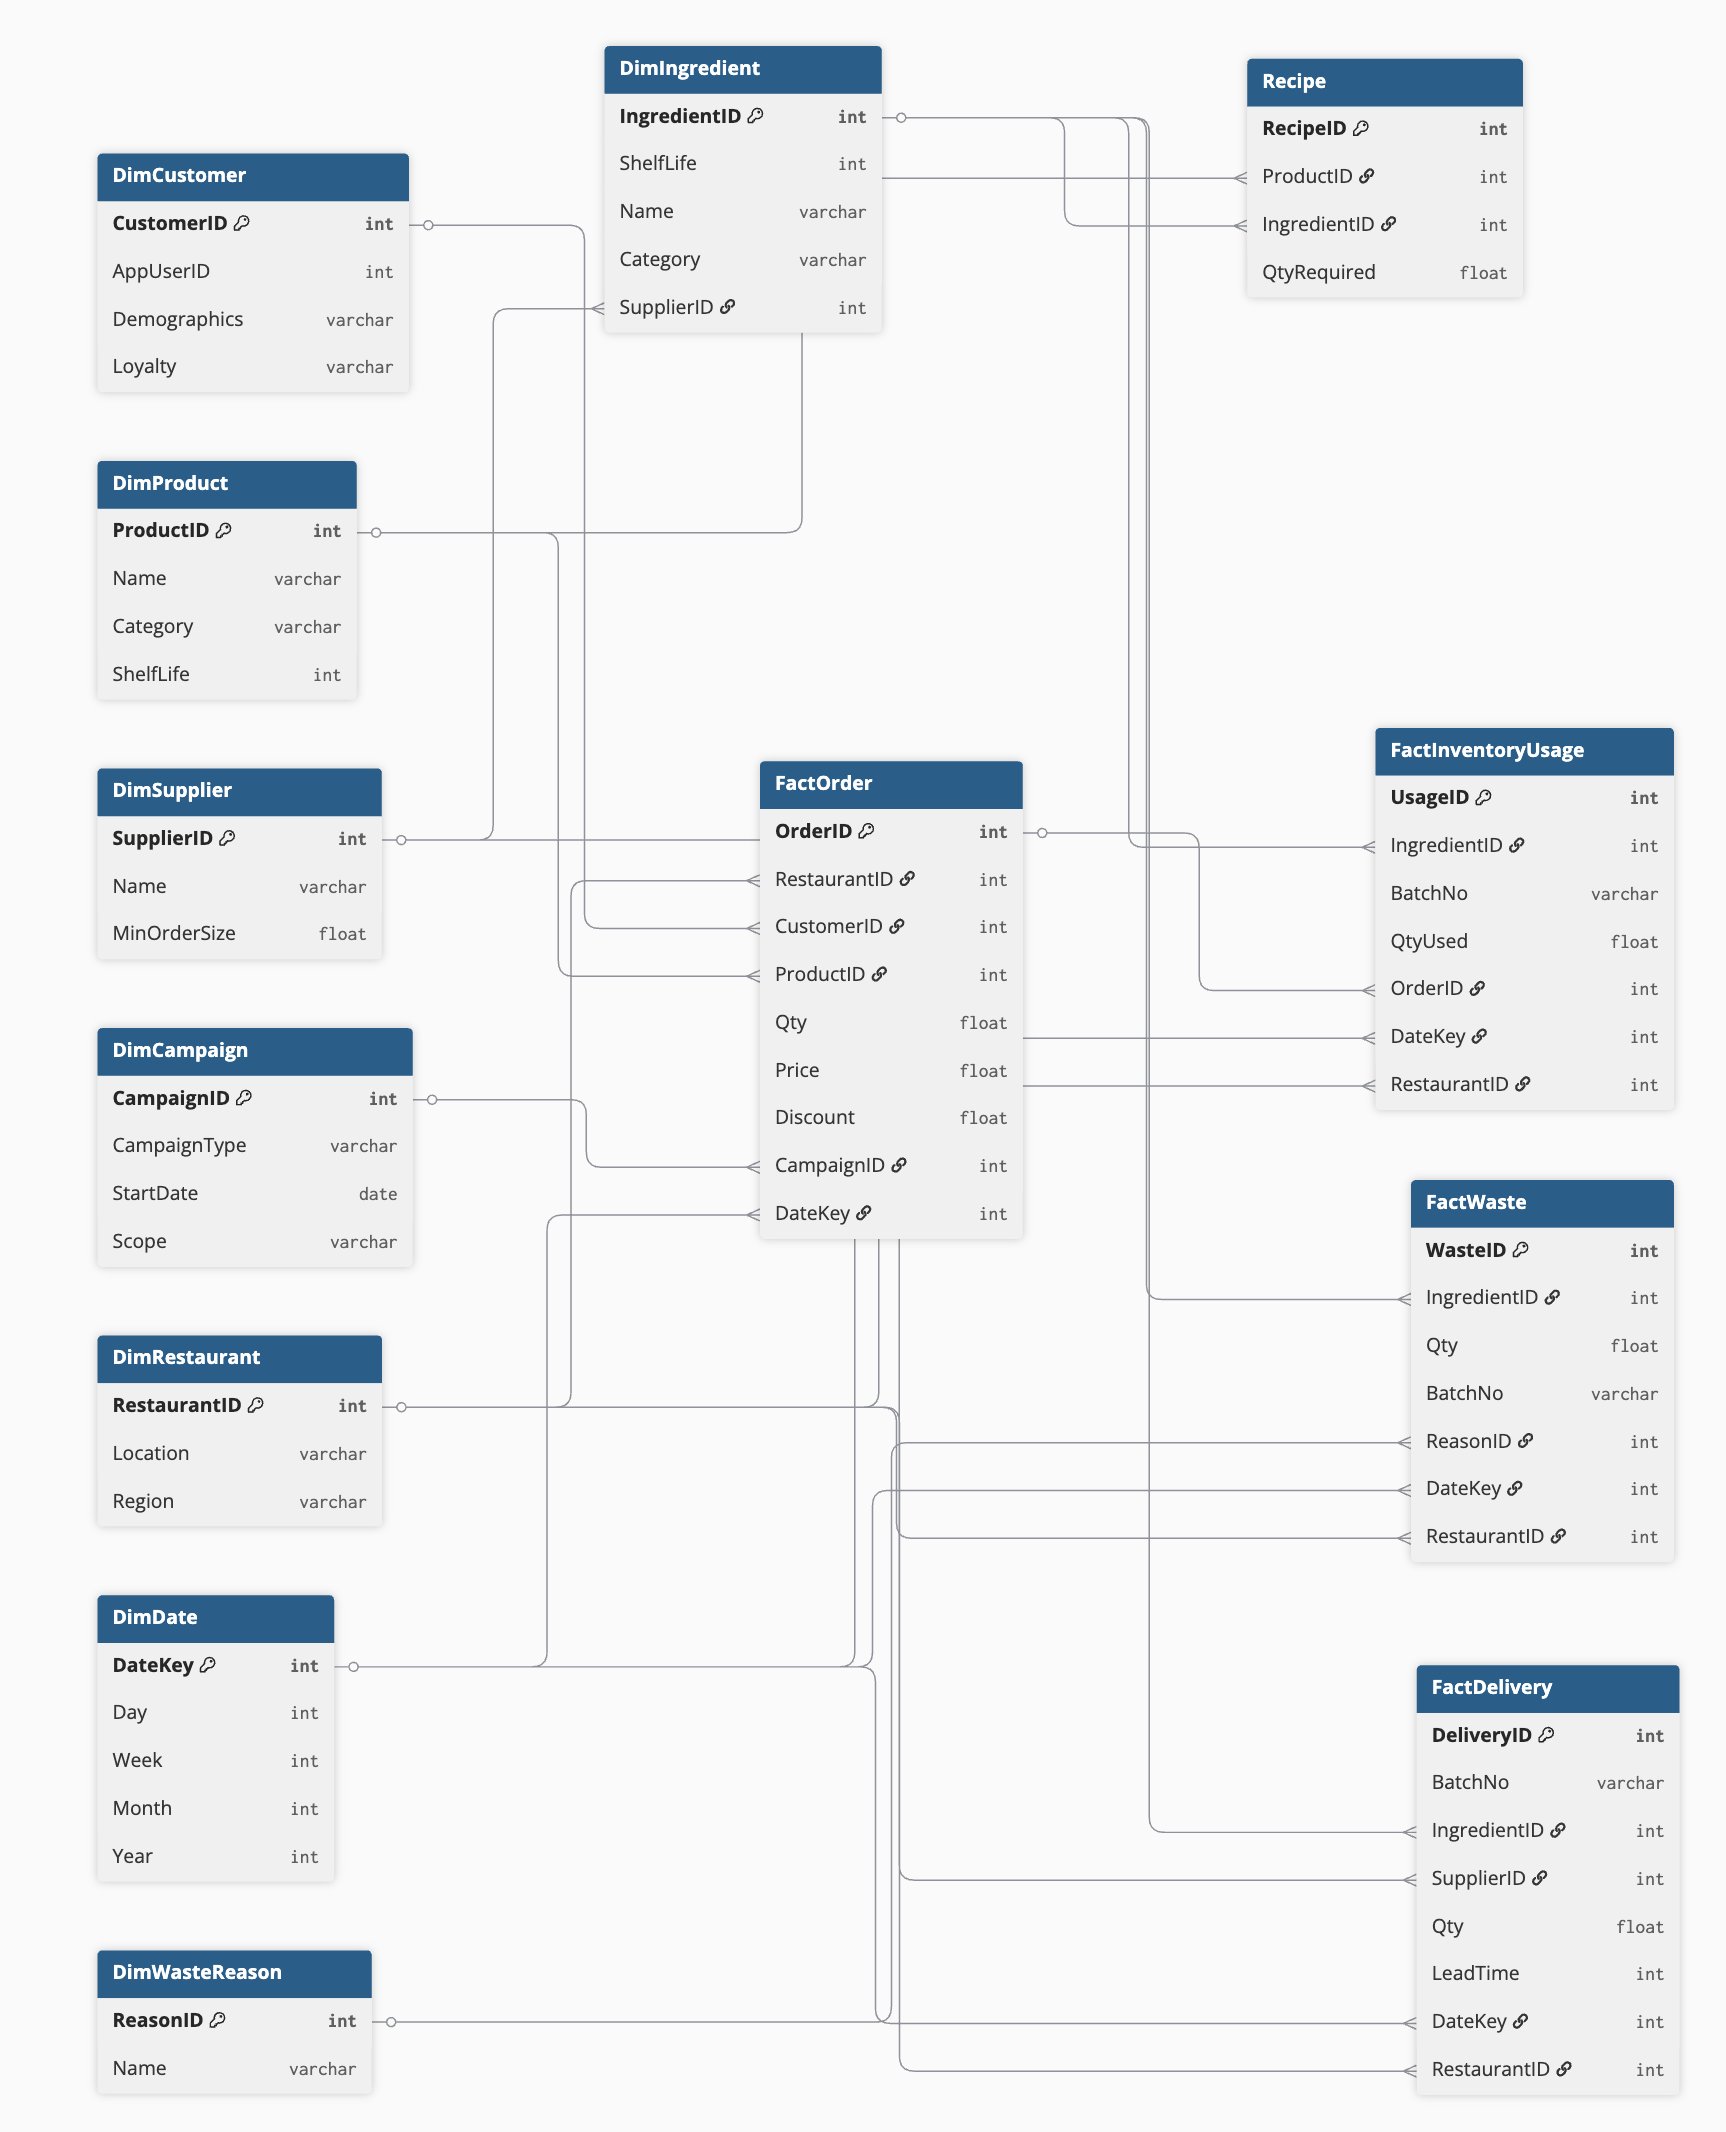
• Star schema – optimized for analytics and BI reporting. Facts capture measurable events (orders, deliveries, waste), while dimensions hold descriptive attributes (customers, products, suppliers, restaurants).
• Recipe bridge – links products to their required ingredients and quantities, enabling demand forecasting at the ingredient level.
• Batch tracking – BatchNo ensures FIFO compliance can be measured and expiry risks identified.
• Waste attribution – FactWaste includes both ReasonID and RestaurantID, allowing analysis of where and why waste occurs.
• Campaign integration – FactOrder links to DimCampaign, so promotional effectiveness can be tied directly to waste reduction efforts.
🔹 Example Questions the Model Can Answer
• Which suppliers and ingredients contribute most to waste, and in which regions?
• How effective was a local discount campaign in reducing expiring lettuce waste?
• Are restaurants following FIFO, or are newer deliveries being consumed before older stock?
• What’s the forecast accuracy gap between ingredient usage (via recipes) and actual deliveries?
🔹 Scalability Considerations
Snowflaking: Supplier and Category dimensions can be normalized further if scale grows.
Customer privacy: PII is minimized in DimCustomer; loyalty/engagement can be analyzed without exposing sensitive data.
Customer analytics relies on anonymized loyalty IDs, not raw PII
Granularity: Model supports analysis at daily, restaurant, batch, or campaign level.
✅ Impact: This schema demonstrates how to design beyond “sales = revenue.” It ties together supply chain efficiency, customer behavior, and sustainability goals, showing how data modelling directly enables smarter operations.
Process
I start every modelling engagement by translating the business goal into a measurable metric, then mapping the customer and supply chain journey to identify every event and entity the model needs to capture. Only then do I start designing tables.
1 .Task
Client: “Our goal is to improve restaurant efficiency by reducing food waste.”
Great — let’s build on that. What does efficiency mean in your context?
The client clarifies: reducing food waste by 20%.
Now I ask: what metric defines waste reduction?
There are multiple angles I could approach this from:
Supply side: optimize order sizes so less food expires in storage.
Demand side: encourage more customer orders to keep stock moving.
Process discipline: ensure restaurants follow FIFO (first-in, first-out) in inventory usage.
Combined approach: optimize inventory management while also shaping demand through promotions and smarter campaigns.
2. Further questions I can discuss to help with actual data modelling:
How do you currently measure food waste?
How much food is currently wasted in the time span you want us to focus on improving?
What incentives do restaurant managers currently have around waste?
Which restaurants and food categories are in scope?
Can we do discounts to sell food that is at risk at expiring soon?
Are there minimum limits to ordering more food ingredients to restaurants? For example an order must be 1000kg before it is delivered.
Does ‘waste’ include plate waste (customers not finishing meals) or only restaurant inventory losses?
Are food ingredients delivered from a central warehouse or from multiple small independent companies?
Which categories have the shortest shelf-life, and how are they currently tracked? Can I connect this with customers’ details so we can directly announce discounts and special campaigns to improve awareness?
Do you track waste reasons?
What systems currently store this data?
What time granularity do we need?
What’s the acceptable margin of error?
Do restaurants differ in menu and supply chains?
Chosen metrics
For this case I recommend to use below metrics:
1. Core KPI (Outcome) – % Waste of Purchased Inventory items.
2. Diagnostic KPIs (Causes)
• Forecast Accuracy
• FIFO Compliance Rate
• Sales-to-Inventory Ratio
3. Levers (Action-Oriented)
• Increase attach rate of perishables (upselling).
• Incentivize demand-shaping campaigns (e.g., “salad of the day”).
3. Process Confirmation. Events and entities we need to consider
1. Customer enters restaurant → Customer entity, visit event.
2. Chooses food & places order → Order header + order line items.
3. Payment captured → Payment transaction entity.
4. Order routed to kitchen → Kitchen event.
5. Kitchen consumes ingredients (FIFO) → Inventory usage transaction.
6. Inventory hits reorder threshold → Reorder event triggered (human or system).
7. Requisition sent to central warehouse → Requisition entity.
8. Warehouse prepares & delivers → Delivery entity with lead time.
9. Inventory replenished → Inventory receipt transaction.
10. Some items move slowly & near expiry → Waste risk flagged.
11. Discount/Ad campaign activated → Campaign entity, customer targeting rules.
12. Customer buys discounted item → Order + campaign attribution.
13. Inventory reduced & waste avoided → Updated waste KPI.
14. Optimization loop → adjust reorder sizes, safety stock, promotions.
4. Modelling
Lets start with a Star schema. If scale grows, I could snowflake Supplier and Category dimensions to reduce redundancy.
Table design
The model is complex as it aims to capture all relevant cross-functional aspects of waste reduction. It will be tricky at first to get all the data and connections planned and working efficiently, but once complete we have a great system to follow and optimize to reduce food waste!
Now we start to see possibilities how this data can be used.
(1) Personal details we can put in a separate secure system to avoid data leaks of personal information.
(2) Run targeted A/B tests on discounts and product placement to reduce ingredient waste (email / app notifications / discounts / product offerings / etc.) get people to buy food items we are aiming to move before expiry.

5. Example Queries
• % of lettuce wasted last month by region → FactWaste → DimIngredient → DimRestaurant → DimDate.
WITH delivered AS (
SELECT
r.Region,
SUM(fd.Qty) AS delivered_lettuce
FROM FactDelivery fd
JOIN DimRestaurant r ON fd.RestaurantID = r.RestaurantID
JOIN DimDate d ON fd.DateKey = d.DateKey
WHERE fd.IngredientID = 'lettuce'
AND d.Month = 8
GROUP BY r.Region
),
wasted AS (
SELECT
r.Region,
SUM(fw.Qty) AS wasted_lettuce
FROM FactWaste fw
JOIN DimRestaurant r ON fw.RestaurantID = r.RestaurantID
JOIN DimDate d ON fw.DateKey = d.DateKey
WHERE fw.IngredientID = 'lettuce'
AND d.Month = 8
GROUP BY r.Region
)
SELECT
w.Region,
ROUND(100.0 * w.wasted_lettuce / d.delivered_lettuce, 2) AS wasted_lettuce_perc
FROM wasted w
JOIN delivered d
ON w.Region = d.Region;
• Was campaign X effective in moving slow ingredients? → FactOrder → DimCampaign → FactInventoryUsage.
SELECT
c.CampaignID,
SUM(iu.QtyUsed) AS total_used
FROM FactInventoryUsage iu
JOIN FactOrder o ON iu.OrderID = o.OrderID
JOIN DimCampaign c ON o.CampaignID = c.CampaignID
WHERE c.CampaignID = 'X'
GROUP BY c.CampaignID;
• FIFO compliance rate → FactInventoryUsage joined with FactDelivery by BatchNo and Date.
SELECT
ROUND(100.0 * SUM(CASE WHEN iu.DateKey >= d.DateKey THEN 1 ELSE 0 END) / COUNT(*), 2)
AS fifo_compliance_pct
FROM FactInventoryUsage iu
JOIN FactDelivery d
ON iu.BatchNo = d.BatchNo AND iu.IngredientID = d.IngredientID;
• Forecast vs. Actual usage → FactOrder (sales) vs FactDelivery (supply) at ingredient level.
SELECT
iu.IngredientID,
SUM(r.QtyRequired * o.Qty) AS forecast_usage,
SUM(iu.QtyUsed) AS actual_usage,
ROUND(100.0 * SUM(iu.QtyUsed) / NULLIF(SUM(r.QtyRequired * o.Qty),0), 2) AS pct_accuracy
FROM FactOrder o
JOIN Recipe r ON o.ProductID = r.ProductID
JOIN FactInventoryUsage iu ON r.IngredientID = iu.IngredientID
GROUP BY iu.IngredientID;
6. How the model changes when data needs updating
1. Fact tables (events)
• Never overwritten. If data changes (e.g., late delivery, corrected waste qty), we insert a new row with the correct numbers.
• This keeps a full history → supports audit and time-based analysis.
2. Dimension tables (attributes)
Two options:
• Overwrite (Type 1 SCD) – if history is irrelevant (e.g., fixing a wrong supplier phone number).
• Append new row with effective dates (Type 2 SCD) – if we must track history (e.g., a restaurant moves from one region to another).
3. Why this matters
• Overwrite → smaller, simpler tables, but no history.
• Append → bigger, more complex, but preserves timelines.
4. Balance
• “We overwrite when corrections don’t matter for trend analysis. We add new rows when historical change is business-relevant.”
Example:
• Correcting a customer’s email → overwrite.
• Restaurant changing region → append new row, mark effective dates.